
SQL Server 2017 ships with a number of new and enhanced Dynamic Management Views (DMVs) and Dynamic Management Functions (DMFs) that will help DBAs monitor the health and performance of SQL Server instances. They are newly built and available only for SQL Server 2017.
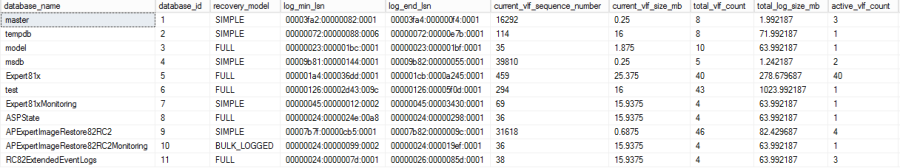
sys.dm_db_log_stats
sys.dm_db_log_stats returns summary level attributes and information on transaction log files of databases. The information includes the recovery model of the database. Use this information for monitoring and diagnostics of transaction log health. It requires the database ID number you want to investigate as an input parameter.
SQL Query
SELECT
       dbs.name AS [database_name],
       ls.*
FROM
       sys.databases AS dbs
       CROSS APPLY sys.dm_db_log_Stats(dbs.database_id) ls
WHERE
       dbs.database_id=ls.database_id
Output
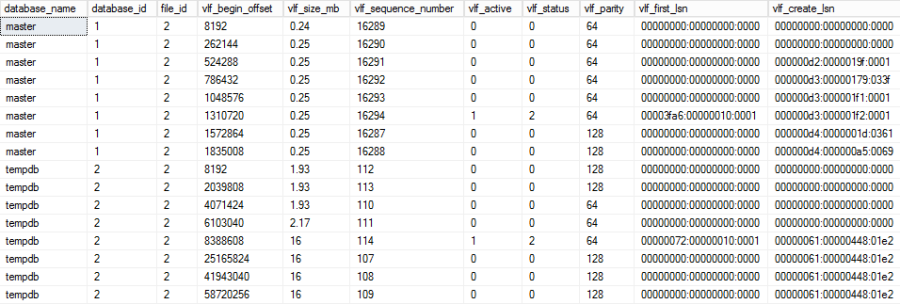
sys.dm_db_log_info
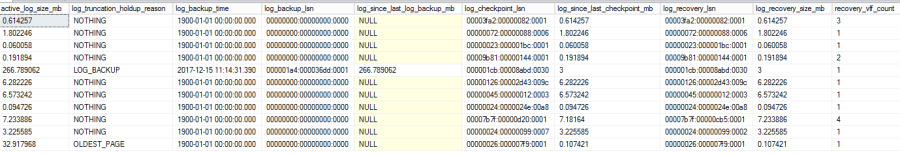
sys.dm_db_log_info returns virtual log file (VLF) information of the transaction log. Each row in the output represents a VLF in the transaction log and provides information relevant to that VLF in the log. It requires the database ID number as an input parameter.
Having a large number of VLFs can negatively impact the start-up and recovery time of your database. With this view, we can see how many VLFs your database currently has, along with their size and status.
SQL Query
SELECT
       dbs.name AS [database_name],
       li.*
FROM
       sys.databases AS dbs
       CROSS APPLY sys.dm_db_log_info(dbs.database_id) li
WHERE
       dbs.database_id=li.database_id
Output
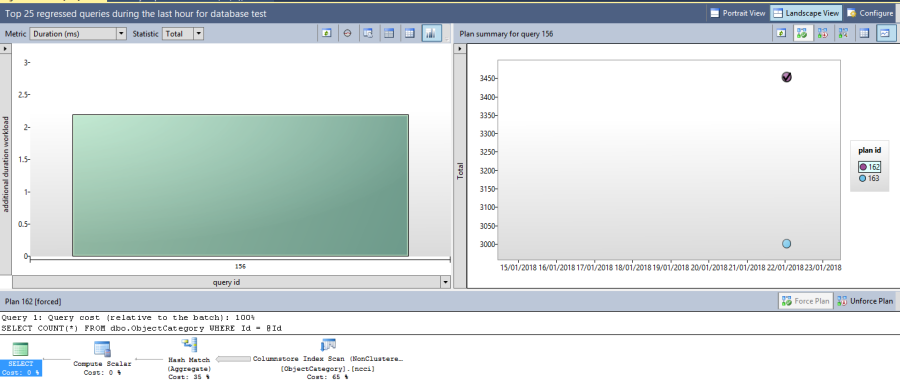
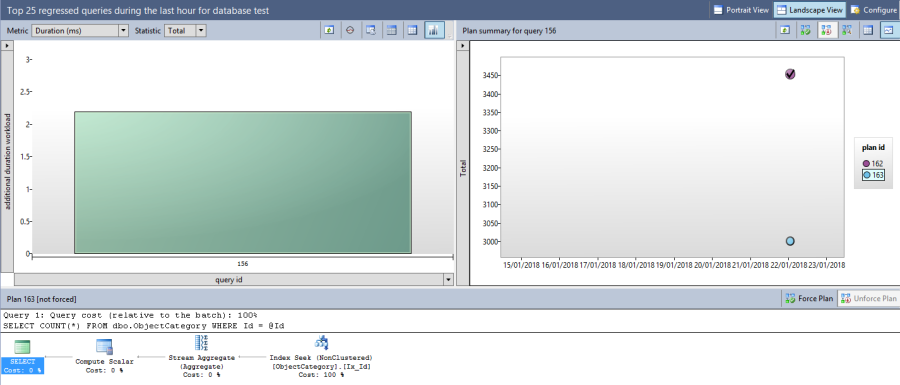
sys.dm_db_tuning_recommendations
sys.dm_db_tuning_recommendations returns detailed information about tuning recommendations. The data is stored in JSON. This requires enabling of the automatic tuning option. If the database engine identifies the plan that is causing regression then a suggestion will be made for fixing it using this DMV.
SQL Query
-- See the tuning recommendations
SELECT  reason,
        score,
        script = JSON_VALUE(details, '$.implementationDetails.script'),
        planForceDetails.[query_id],
        planForceDetails.[new plan_id],
        planForceDetails.[recommended plan_id],
        estimated_gain = (regressedPlanExecutionCount+recommendedPlanExecutionCount)*(regressedPlanCpuTimeAverage-recommendedPlanCpuTimeAverage)/1000000,
        error_prone = IIF(regressedPlanErrorCount>recommendedPlanErrorCount, 'YES','NO')
FROM   sys.dm_db_tuning_recommendations
CROSS APPLY OPENJSON (Details, '$.planForceDetails')
                WITH (  [query_id] int '$.queryId',
                        [new plan_id] int '$.regressedPlanId',
                        [recommended plan_id] int '$.recommendedPlanId',
                        regressedPlanErrorCount int,
                        recommendedPlanErrorCount int,
                        regressedPlanExecutionCount int,
                        regressedPlanCpuTimeAverage float,
                        recommendedPlanExecutionCount int,
                        recommendedPlanCpuTimeAverage float ) as planForceDetails;
Output

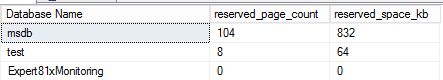
sys.dm_tran_version_store_space_usage
sys.dm_tran_version_store_space_usage returns a table that displays total space in tempdb used by version store records for each database. This is pretty useful in proactively monitoring the tempdb sizing on the version store usage requirement of each database. It returns the aggregated version store space consumed in tempdb per database. It doesn’t have any arguments that need to be supplied. The results show the Database ID, the count of pages reserved in tempdb for version store records, and the total space in kilobytes.
SQL Query
The following query can be used to determine space consumed in tempdb by version store of each database in a SQL Server instance.
SELECT
  DB_NAME(database_id) AS 'Database Name',
  reserved_page_count,
  reserved_space_kb
FROM sys.dm_tran_version_store_space_usage;
Output
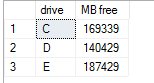
sys.dm_os_enumerate_fixed_drives
In earlier version of SQL Server if a DBA needs to find the free space on the drive then he would be using xp_fixeddrives extended stored procedure.
EXEC xp_fixeddrives
The output is as below on my machine, which has three drives.
In SQL Server 2017, a new DMV sys.dm_os_enumerate_fixed_drives has been introduced which would do the same things. Here is the query.
SELECT fixed_drive_path
    ,free_space_in_bytes / (1024 * 1024) 'Free Space'
    ,drive_type_desc
FROM sys.dm_os_enumerate_fixed_drives
The output is as shown below.
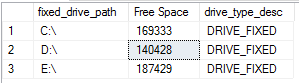
As we can see, the output is same as earlier extended procedure. Using this DMV we can figure out the number of fixed drives (hard drive) a system has along with free space on each of those drives. Using this DMV we can also detect if the disk space is running low on SQL Server.
sys.dm_os_file_exists
In earlier version of SQL Server if a DBA needs to validate that a file exists or not then he would be using xp_fileexist extended stored procedure.
EXEC xp_fileexist 'C:\Backups\DB16_ST_MASTER_81GA_MBOFF.bak';
The output is as shown below.

In SQL Server 2017, a new DMF sys.dm_os_file_exists has been introduced which would do the same things. Here is the query.
SELECT * FROM sys.dm_os_file_exists('C:\Backups\DB16_ST_MASTER_81GA_MBOFF.bak');
The output is as shown below.


As we can see, the output is same as earlier extended procedure.
References
https://docs.microsoft.com/en-us/sql/relational-databases/automatic-tuning/automatic-tuning