Disk Space Monitoring

You may often need to check, if the disk space is running out of space on SQL Server. From SQL Server 2008 R2 SP1 introduces a DMF – Dynamic Management Function (sys.dm_os_volume_stats) that exposes several attributes of the physical disk drives that contain your database files. You can run the below script to get the disk utilization detail by SQL Server.

SQL Query

SELECT DISTINCT
              volume_mount_point [Disk Mount Point],
              file_system_type [File System Type],
              logical_volume_name as [Logical Drive Name],
              CONVERT(DECIMAL(18,2),total_bytes/1073741824.0) AS [Total Size in GB], ---1GB = 1073741824 bytes
              CONVERT(DECIMAL(18,2),available_bytes/1073741824.0) AS [Available Size in GB], 
              CAST(CAST(available_bytes AS FLOAT)/ CAST(total_bytes AS FLOAT) AS DECIMAL(18,2)) * 100 AS [Space Free %]
FROM sys.master_files
CROSS APPLY sys.dm_os_volume_stats(database_id, file_id)

Output

5

References

https://docs.microsoft.com/en-us/sql/relational-databases/system-catalog-views/sys-master-files-transact-sql

https://docs.microsoft.com/en-us/sql/relational-databases/system-dynamic-management-views/sys-dm-os-volume-stats-transact-sql

Recent Full Backups

This query returns information on the recent full backups taken for the current database. This query helps you to find out the backup sizes, backup timings, backup location etc.

SQL Query

SELECT TOP (30) bs.machine_name, bs.server_name, bs.database_name AS [Database Name], bs.recovery_model,
CONVERT (BIGINT, bs.backup_size / 1048576 ) AS [Uncompressed Backup Size (MB)],
CONVERT (BIGINT, bs.compressed_backup_size / 1048576 ) AS [Compressed Backup Size (MB)],
CONVERT (NUMERIC (20,2), (CONVERT (FLOAT, bs.backup_size) /
CONVERT (FLOAT, bs.compressed_backup_size))) AS [Compression Ratio], bs.has_backup_checksums, bs.is_copy_only, bs.encryptor_type,
DATEDIFF (SECOND, bs.backup_start_date, bs.backup_finish_date) AS [Backup Elapsed Time (sec)],
bs.backup_finish_date AS [Backup Finish Date], bmf.physical_device_name AS [Backup Location], bmf.physical_block_size
FROM msdb.dbo.backupset AS bs WITH (NOLOCK)
INNER JOIN msdb.dbo.backupmediafamily AS bmf WITH (NOLOCK)
ON bs.media_set_id = bmf.media_set_id 
WHERE bs.database_name = DB_NAME(DB_ID())
AND bs.[type] = 'D' -- Change to L if you want Log backups
ORDER BY bs.backup_finish_date DESC OPTION (RECOMPILE);

Output

12

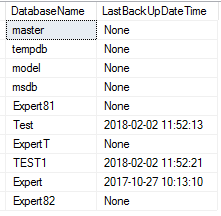
The following query returns the Last Backup Date Time for each database on your Instance.

SQL Query

SELECT
    db.Name AS DatabaseName,
    COALESCE(CONVERT(VARCHAR(19), MAX(bs.backup_finish_date), 120),'None') AS LastBackUpDateTime
FROM
    sys.sysdatabases db
    LEFT OUTER JOIN msdb.dbo.backupset bs
    ON bs.database_name = db.name
GROUP BY
    db.Name;

Output

3

The following query returns the databases that have never had a backup, or the current backup is over 24 hours old.

SQL Query

SELECT
    db.Name AS DatabaseName,
    COALESCE(CONVERT(VARCHAR(19), MAX(bs.backup_finish_date), 120),'None') AS LastBackUpTime
FROM
    sys.sysdatabases db
    LEFT OUTER JOIN msdb.dbo.backupset bs
    ON bs.database_name = db.name
GROUP BY
    db.Name
HAVING
    MAX(bs.backup_finish_date) < DATEADD(dd,-1,GETDATE())
    OR MAX(bs.backup_finish_date) IS NULL;

Output

4

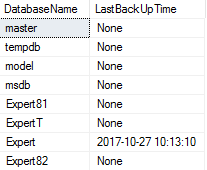
By reviewing the output from these scripts, you will be able to identify the last backup for the databases on your instance.

References

https://technet.microsoft.com/en-us/library/ms186299(v=sql.110).aspx

https://technet.microsoft.com/en-us/library/ms190284(v=sql.110).aspx


Capture the Most Expensive Queries Using Query Store

Generally we generate queries based on the dynamic management view sys.dm_exec_query_stats to capture the most resource hungry queries across a SQL instance. That approach has some drawbacks though. First, it is cleared out every time an instance restarts, and second it only keeps figures for currently cached plans, so when a query recompiles, data is lost.

Alternatively we can use SQL Server Query Store option for this purpose. One of the great features of it is that performance stats are stored in the database, so they aren’t lost in either of the above scenarios.

This query will produce a ranked list of your most expensive queries for the current database. The query requires that Query Store is enabled for the database. 

SQL Query

SELECT
                DB_NAME() AS DatabaseName,
                s.name AS SchemaName,
                o.name AS ObjectName,
                SUBSTRING(t.query_sql_text,1,1000) AS QueryText,
                SUM(rs.count_executions) AS TotalExecutions,
                SUM(rs.avg_duration * rs.count_executions) AS TotalDuration,
                SUM(rs.avg_cpu_time * rs.count_executions) AS TotalCPU,
                SUM(rs.avg_logical_io_reads * rs.count_executions) AS TotalLogicalReads
          FROM sys.query_store_query q
          INNER JOIN sys.query_store_query_text t
                ON q.query_text_id = t.query_text_id
          INNER JOIN sys.query_store_plan p
                ON q.query_id = p.query_id
          INNER JOIN sys.query_store_runtime_stats rs
                ON p.plan_id = rs.plan_id
          INNER JOIN sys.query_store_runtime_stats_interval rsi
                ON rs.runtime_stats_interval_id = rsi.runtime_stats_interval_id
          LEFT JOIN sys.objects o
                ON q.OBJECT_ID = o.OBJECT_ID
          LEFT JOIN sys.schemas s
                ON o.schema_id = s.schema_id    
          WHERE rsi.start_time >= DATEADD(hour, -1, GETUTCDATE())
          GROUP BY s.name, o.name, SUBSTRING(t.query_sql_text,1,1000)
          OPTION(RECOMPILE) 

Output

10

References

https://docs.microsoft.com/en-us/sql/relational-databases/system-dynamic-management-views/sys-dm-exec-query-stats-transact-sql

https://docs.microsoft.com/en-us/sql/relational-databases/system-catalog-views/sys-query-store-query-text-transact-sql

https://docs.microsoft.com/en-us/sql/relational-databases/system-catalog-views/sys-query-store-query-transact-sql

https://docs.microsoft.com/en-us/sql/relational-databases/system-catalog-views/sys-query-store-plan-transact-sql

https://docs.microsoft.com/en-us/sql/relational-databases/system-catalog-views/sys-query-store-runtime-stats-transact-sql

https://docs.microsoft.com/en-us/sql/relational-databases/system-catalog-views/sys-query-store-runtime-stats-interval-transact-sql


User Defined Functions Execution Statistics

This query returns User-Defined Functions (UDFs) execution statistics for the current database.

SQL Query

SELECT OBJECT_NAME(object_id) AS [Function Name], execution_count,

          total_worker_time, total_logical_reads, total_physical_reads,

       total_elapsed_time

FROM sys.dm_exec_function_stats WITH (NOLOCK)

WHERE database_id = DB_ID()

ORDER BY total_worker_time DESC OPTION (RECOMPILE);

Output

3

References

https://docs.microsoft.com/en-us/sql/relational-databases/system-dynamic-management-views/sys-dm-exec-function-stats-transact-sql